Tis the season….
……for making sure your YOY analytics are working
Why now?
- January is soon to be upon us and 2015 data will start to pour in
- You may now have almost a whole year to look back on
- This might show you your seasonal patterns
- This might show key moments in the year
- Frankly, if you have not already done all you can for Christmas online, you are starting a bit late so let’s focus on 2015
- For online retail, ‘Cyber Monday’ may well be the highest traffic you are going to get this year. Or perhaps it was the January sale in 2014? A good time to compare and prepare.
Annotations, Annotations, Annotations
- Can you remember what you were doing with your site this time last year?
- Do you know what others in your team or company were doing with the site this time last year?
- Is everyone using annotations? Are they meaningful?
Site structure integrity
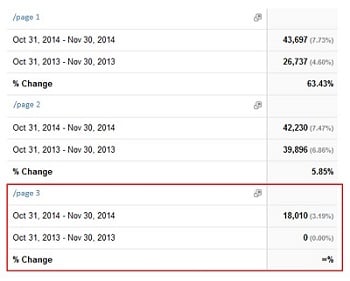
Site structure/URL changes from one year to the next can cause chaos with analytics comparison
- Creating separate profiles will separate the data but you can’t then compare YOY
- Grouping URLs can allow you to roughly see the performance YOY
- You might have to export the data and compare manually but make sure you do this the same way each time!

Picking your dates to compare
Large data sets can make whole YOY comparisons hard as the data will sample in GA or just be super slow in other systems
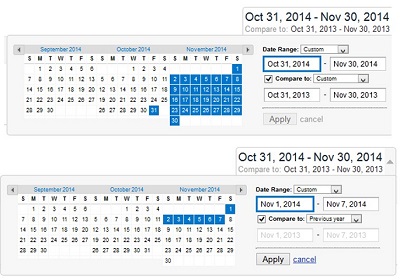
Picking a suitable date range to compare YOY is important
- Pick a month or week
- Choose the same starting day of the week regardless of month

What can you then use this for?
Unlike viewing data month on month or even week on week, if seasonality typically has an impact on your business then ‘Year On Year’ is the only real way of looking at your data and gaining meaningful insights from them. In fact there are very few circumstances where a year on year view on data isn’t going to prove valuable in some way.
By ensuring that you have a robust method for comparing your data year on year, it will provide an essential input into decisions around content, acquisition channels, conversion rates and almost all aspects of how you currently look at your data.
Things to look for might include:
- A key piece of content isn’t performing as well as last year. Maybe just fewer page views or a big increase in bounce rates. This can then provide a point for investigation and could lead to simple fixes.
- Certain acquisition channels are perhaps not driving as much traffic as in the previous year. Has this been absorbed by another channel? What pages was that channel driving to last year? Do they exist in the same way now?
- Conversion rates are down year on year. Was there a particular page that drove lots of conversions last year? Has that page changed or been removed?
These may all sound like obvious things to look for, but without making sure you have robust capability to measure this year on year, then you may be missing some really obvious gaps in your sites performance.
There is nothing worse than attempting year on year analysis and then discovering that you are simply not set up to do this. So now would be an ideal time to enter 2015 with a clean reporting benchmark.
Feel free to speak to us and find out how our Data and Insights team can help you to make the most out of your data.


