Numbers Now On Google Trends
by David Brooks | 13.06.2008
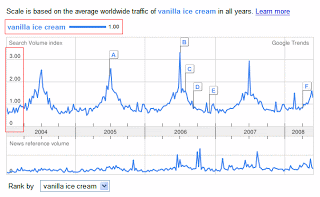
 Google have added some new numbers to their popular application, Google Trends. Before all you would get is the line graph and nothing else, now you get numbers which scale each peak and give you a better estimate. Below is what they say about the new numbers:
” You’ll notice a number at the top of the graph as well as on the y-axis of the graph itself. These numbers don’t refer to exact search-volume figures. Instead, in the same way that a map might “scale†to a certain size, Google Trends scales the first term you’ve entered so that its average search volume is 1.00 in the chosen time period. So in the example above, 1.00 is the average search volume of vanilla ice cream from 2004 to present. We can then see a spike in mid-2006 which crosses the 3.00 line, indicating that search traffic is approximately 3 times the average for all years. Read more about how we scale the data ”
Read the full article here.


